Recently i gave a talk at a Microsoft Integration Commuity Event on Azure IoT Hub. In the demo i used Azure Stream Analytics for ingestion and PowerBi as its output.
To demo the IoT Hub bidirectional feature it had an abnormal detection scenario using Stream Analytics together with EventHub and a Azure Function sending a message back to the device.
The scenario is illustrated below:
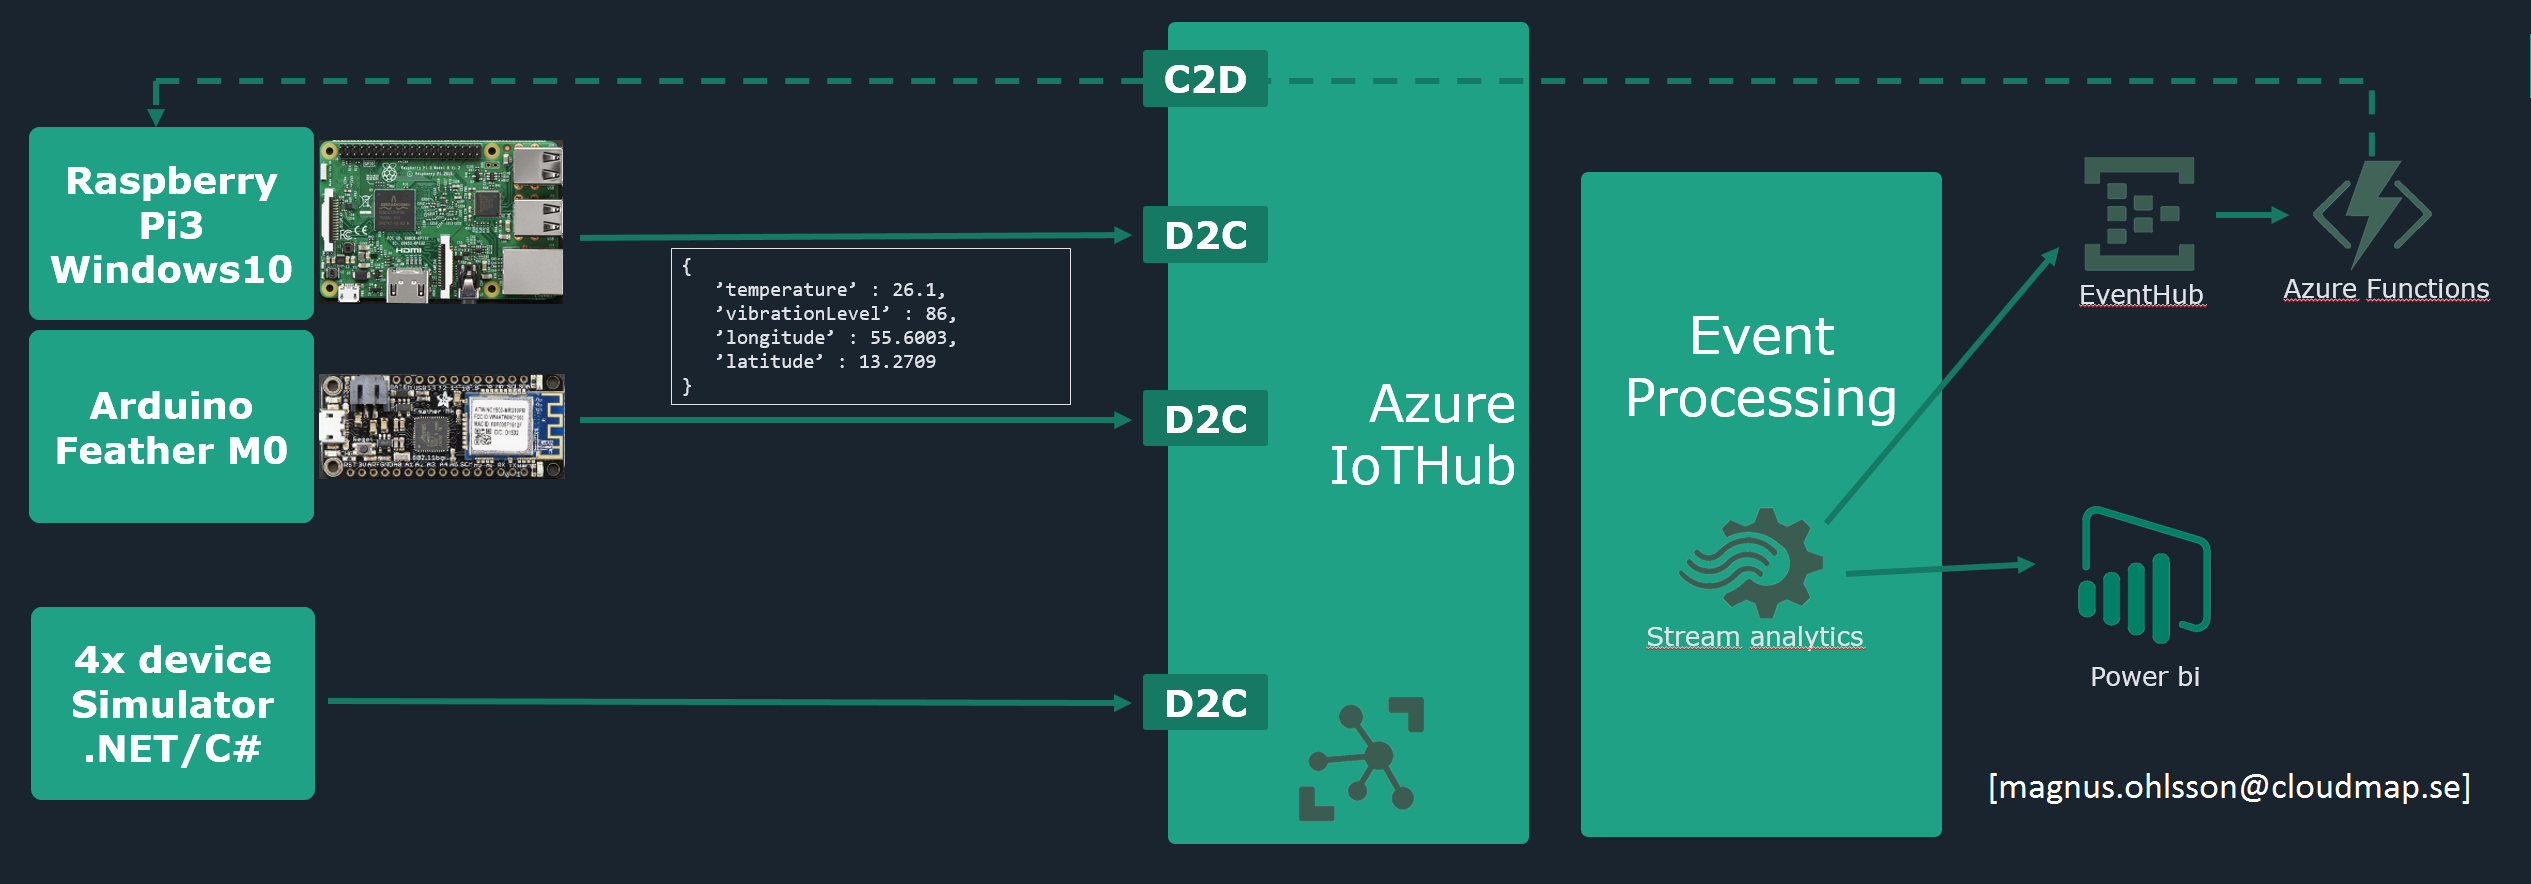
I used two real devices and one multi-device simulator written in C#.
- Raspberry Pi 3 + GrovePi+ with sensors for temperature/humidy, rotary and a LCD-display. OS was Windows 10 IoT Core and a custom UWP app that sent the telemetry data to IoT Hub every second.
- Adafruit Feather M0 (sensor: BME280 for temperature/humidity). The SDK used was the one from here https://github.com/Azure/azure-iot-arduino. It has only HTTP support at the moment but MQTT is said to be coming very soon.
- C# Simulator was a commandline application with a random telemetry simulator to get somewhat realistic movements on its faked sensors.
The Azure Stream analytics jobs had 1 input, 2 outputs and a two part query. One for the PowerBi output where “group by TumblingWindow” was used and one for the abnormal detection (vibrationLevel > 400).
Stream Analytics Query:
WITH
Normal AS
(
SELECT
System.Timestamp AS time,
deviceId,
AVG(temperature) AS avgtemperature,
AVG(humidity) AS avghumidity,
MAX(vibrationLevel) AS maxvibrationlevel,
longitude,
latitude
FROM [devices-in]
GROUP BY
TUMBLINGWINDOW(second,5), time, deviceId, longitude, latitude
),
Abnormal AS
(
SELECT deviceId, MAX(vibrationLevel) as maxvibrationlevel from [devices-in]
GROUP BY TUMBLINGWINDOW(second,30), deviceId
)

SELECT * INTO [pbi-out] FROM Normal
SELECT * INTO [abnormal-vibro-out] FROM Abnormal WHERE vibrationlevel > 400
The TumblingWindow (together with Sliding and Hopping -window) is the star of Stream Analytics. Thousands (or millions!) of devices sending telemetry data every second can be grouped using a time window. For demo purposes i used a short window.
The EventHub output for the abnormal scenario was read by an Azure Function that sent a Cloud-2-Device message back to the device that caused a background color change and a message on the LCD.
Azure Function code :
#r "Newtonsoft.Json"

using System;
using System.Net;
using Newtonsoft.Json;
using Microsoft.Azure.Devices;

public static void Run(string alertMessage, TraceWriter log)
{
     log.Info($"Got message {alertMessage} from eventhub");
     string connectionString = System.Configuration.ConfigurationManager.ConnectionStrings["iothub"].ConnectionString.ToString();

     dynamic messageIn = JsonConvert.DeserializeObject(alertMessage);
     string deviceid = messageIn.deviceid;
     log.Info($"Will send alert notification to device {deviceid}");

     ServiceClient serviceClient = ServiceClient.CreateFromConnectionString(connectionString);
     var message = new {
         alert = true,
         display = "TECH. DISPATCHED!"
         };

     var commandMessage = new Message(System.Text.Encoding.ASCII.GetBytes(JsonConvert.SerializeObject(message)));
     serviceClient.SendAsync(deviceid, commandMessage);
     log.Info($"Sent {message} to device {deviceid}");
}
After some simplified PowerBI reporting the demo looked like this:
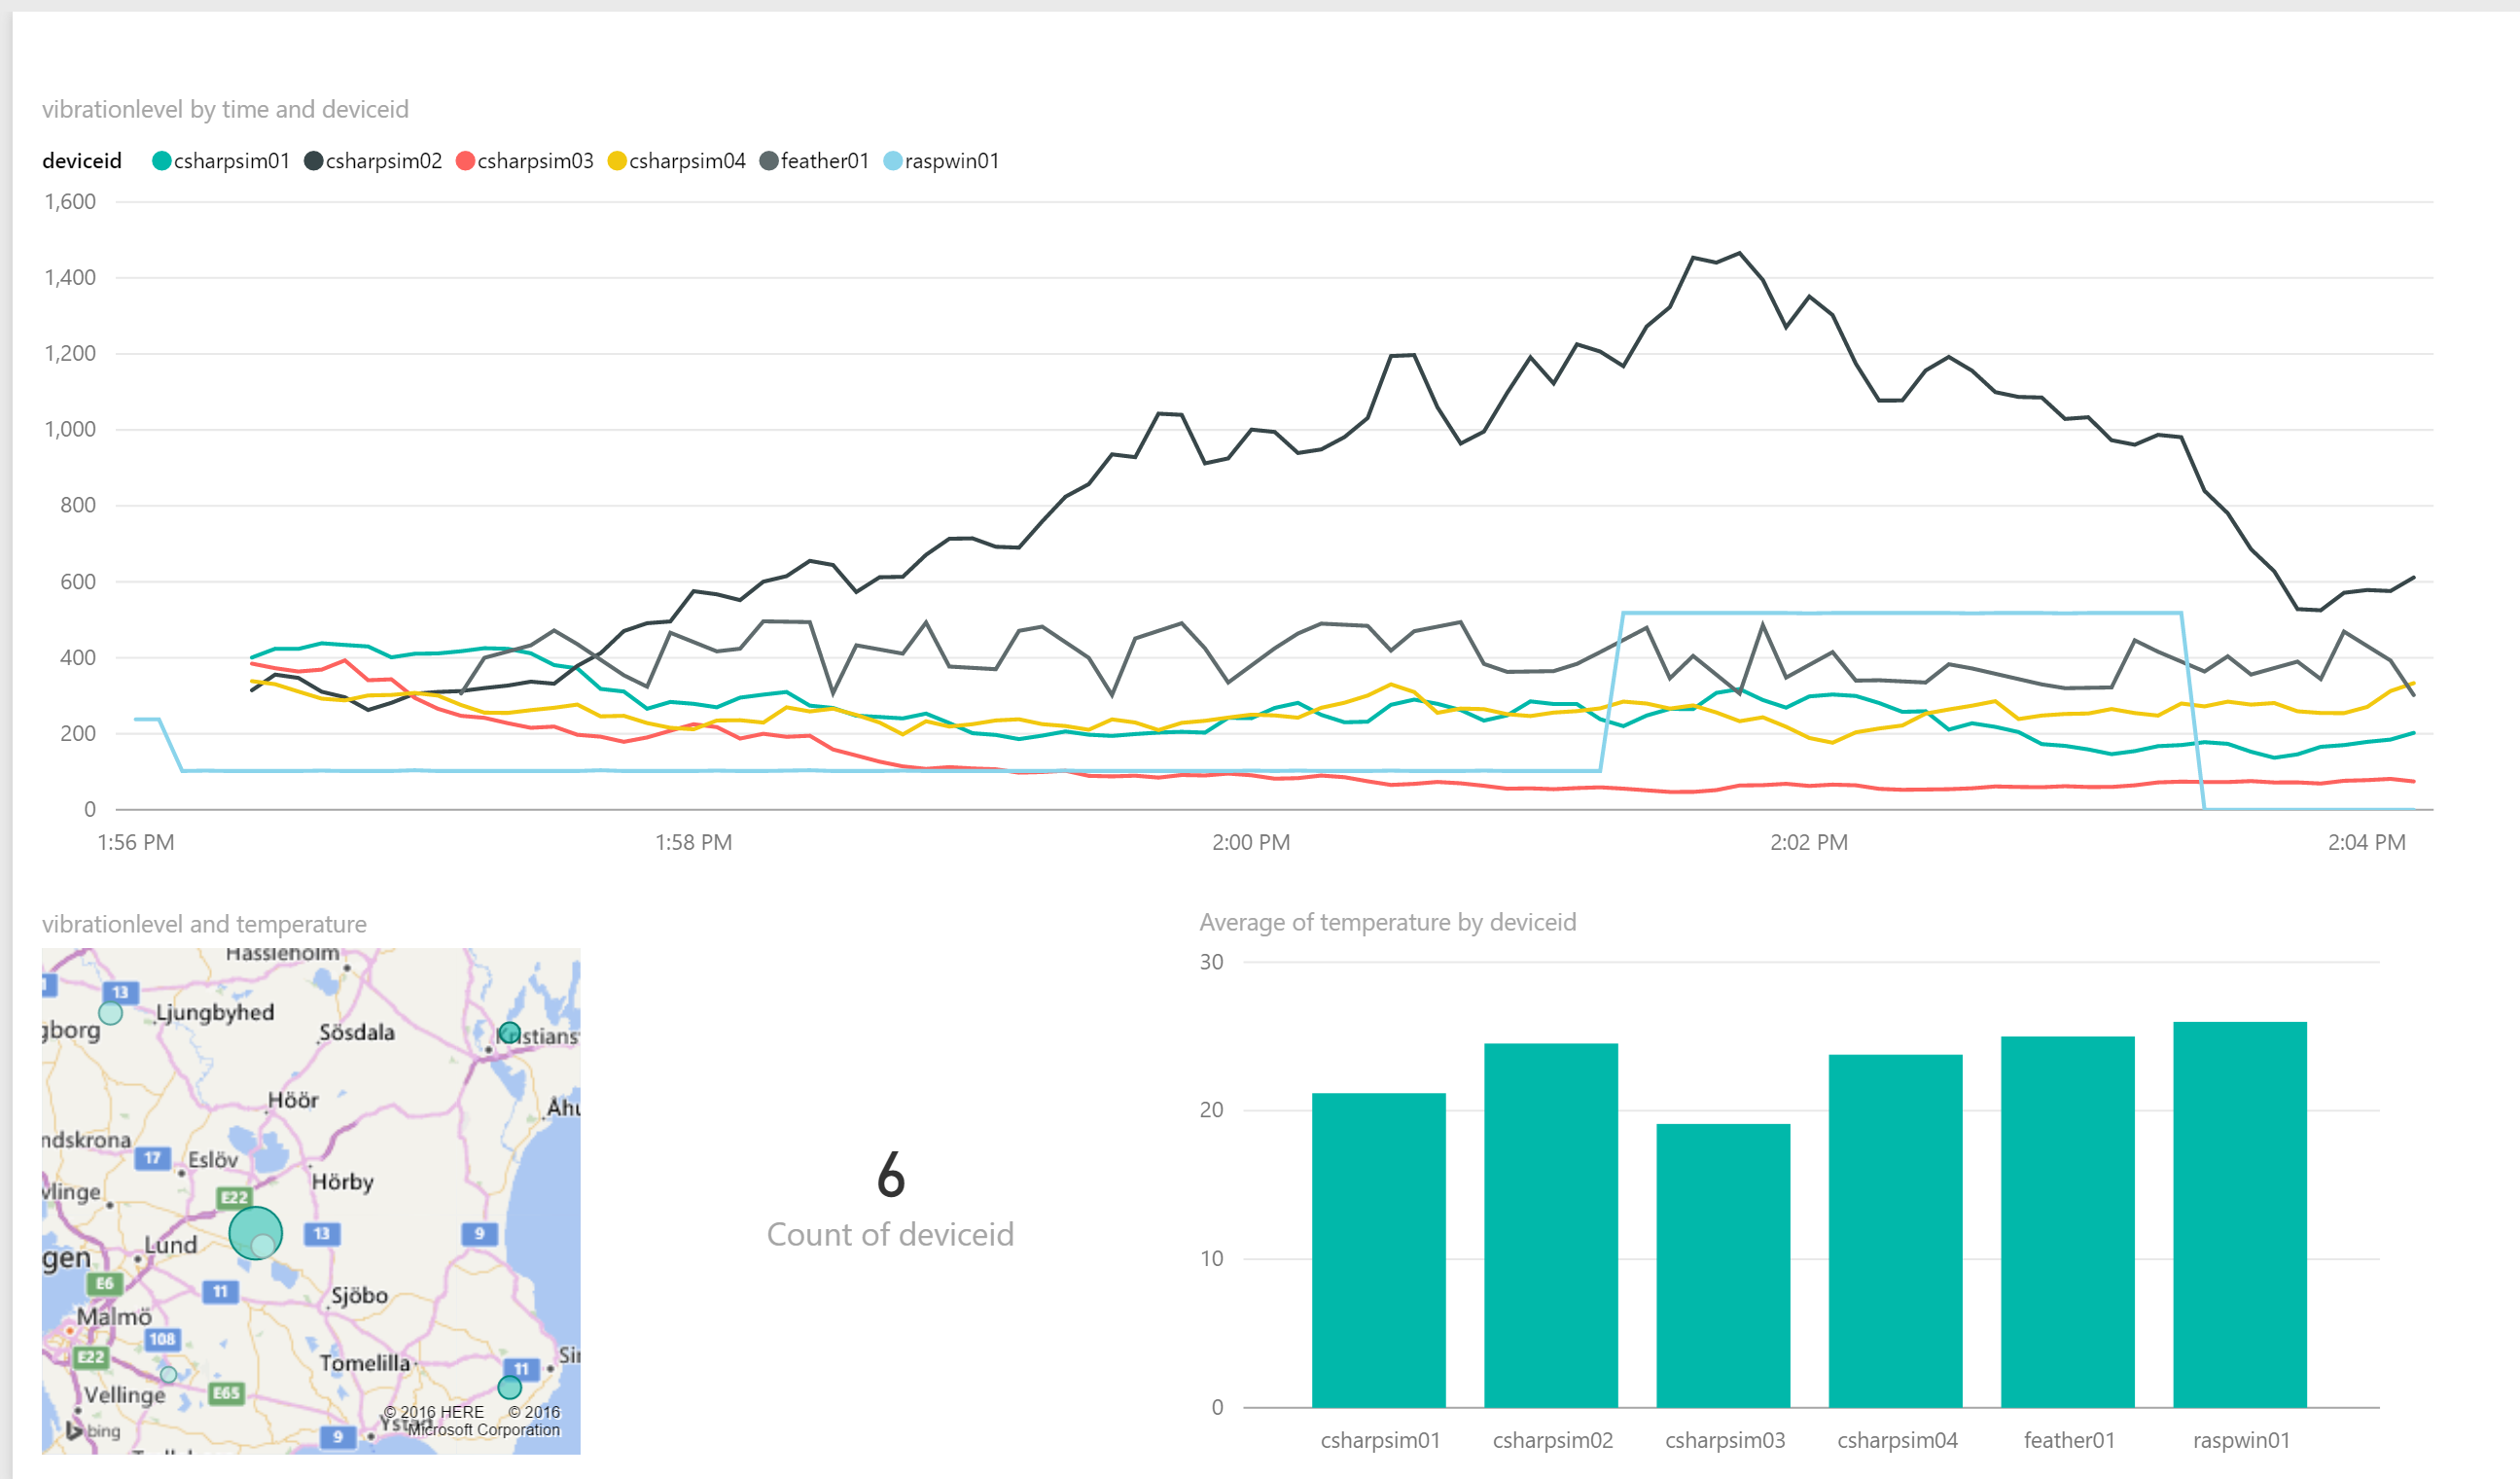
The map highlights the location of the devices and the circle size are related to the vibration level.
The real power here is the scaling. Knowing that one could take this from 6 devices to millions (and back down again!) without any investment or upfront costs is pretty amazing and unthinkable just a couple years ago. That is what cloud computing means to me.